In this article, we show how the Tax Cuts and Jobs Act (TCJA) affected the distribution of corporate effective tax rates. To do so, we collect data on over 3,000 companies from Compustat over the past decade or so. We create our sample after that of Dyreng et al (2017). It consists of nonfinancial, nonutility firms during the years 2010-2018 with at least $10 million in total assets. We exclude firms with negative pretax income and require each firm to have at least five years of data. Importantly, when the ETR is greater than 100% or less than 0%, we reset it to equal 100% or 0%, respectively, which helps reduce the effects of outliers on the figures below.
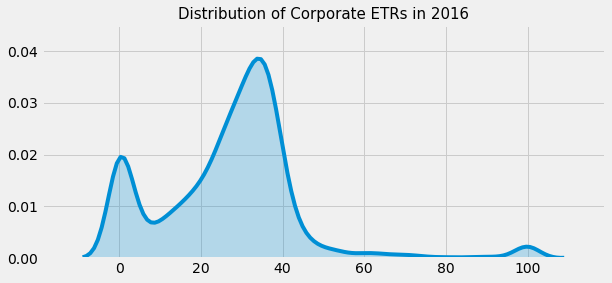
We plot the distribution of ETRs using a smoothing function called Kernel Density Estimation, just to tidy it up a bit. Here is the distribution from 2010 to 2015 and 2016. Comparing the plots below, we can see that the distribution of ETRs in 2016 is comparable to that of 2010-2015.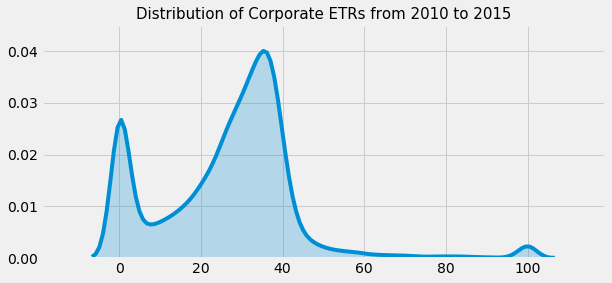
In the figure below, we plot the distribution of corporate ETRs for 2017 – it looks significantly different. It has considerably thicker tails because there are far more outliers in 2017 than in previous years. Moreover, in 2017, a company was more likely to report a 0% ETR than a 35% ETR. Does this imply widespread tax avoidance in a single year? Almost certainly not. Instead, the “fat tails” of the distribution imply that many companies made significant tax adjustments in 2017 that led to more extreme ETRs.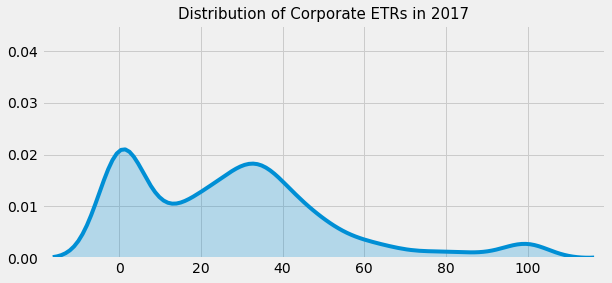
In 2018, the following year, the distribution starts to resemble its pre-TCJA shape again, albeit with some changes. The average corporate ETR is now just over 20%, which is lower than what it had been before TCJA and makes sense given the reduced statutory tax rate. Additionally, the tails of the distribution are thicker than before, indicating that sample’s proportion of outliers increased substantially after TCJA.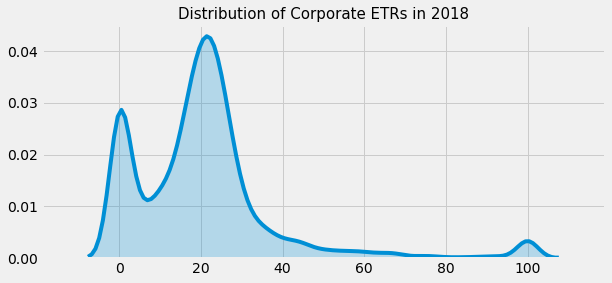
(Source for all figures: Compustat)